Asking a question, meeting R, and making your first graph
Important
Getting stuck is not failing — it is the job.
Every working scientist reads error messages and searches for answers every day.
Note
Today’s roadmap
Example:
Note
📖 New word
Falsifiable = a prediction that could, in principle, be proven wrong. A good hypothesis is one you could disprove.
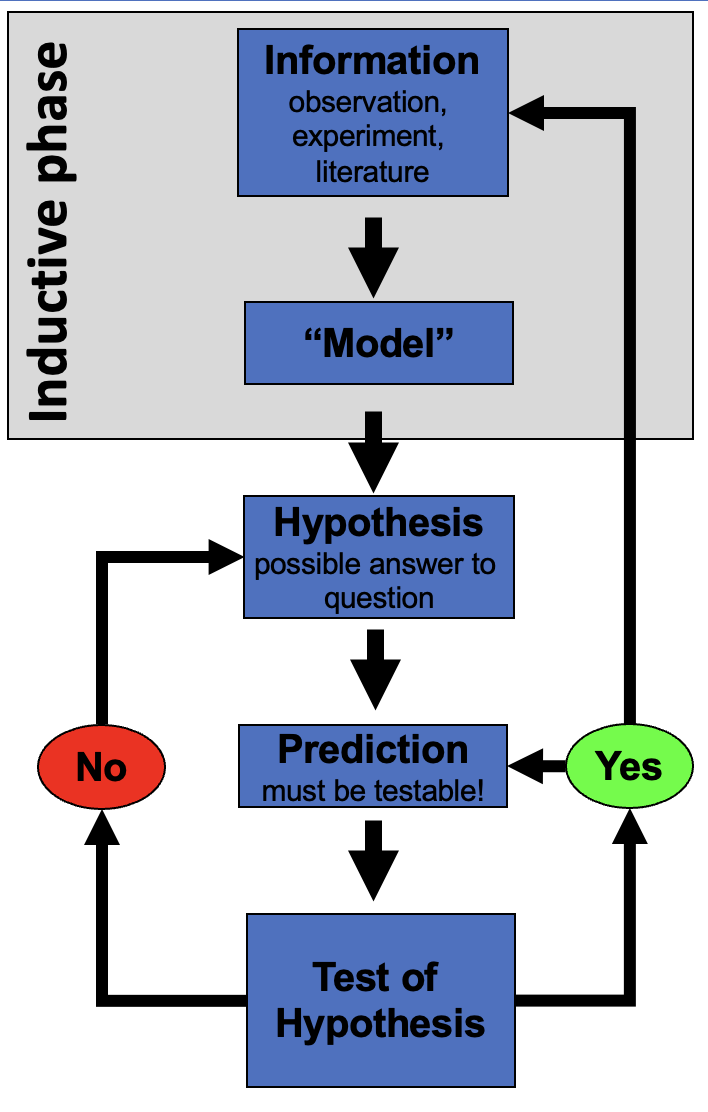
Inductive (specific → general)

You measure needles on a few trees, notice a pattern, and generalize: “needle length seems to vary with side of tree.”
Note
Weakness: the pattern held in your sample — it is not guaranteed to hold everywhere.
Deductive (general → specific)
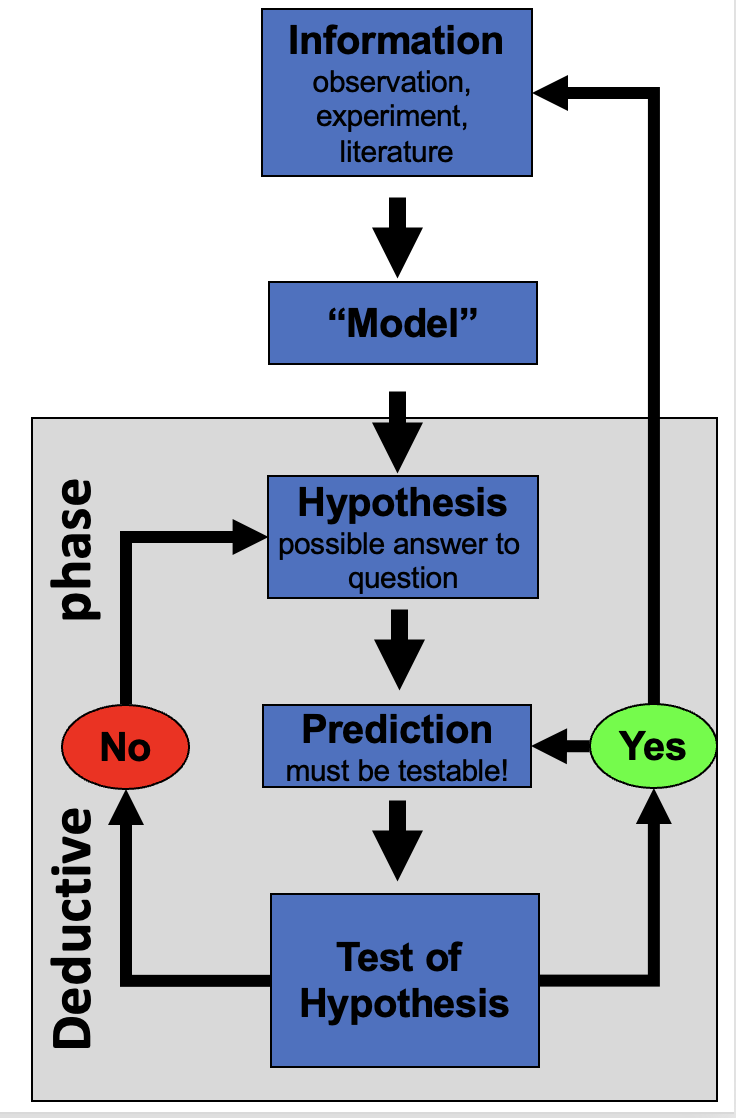
You start from a general rule — “exposure affects needle length” — and predict what a new tree should show, then check.
Note
Weakness: only as strong as the general rule you started from.
Tip
In practice we do both, back and forth — notice a pattern (induction), propose a rule, then test it on new data (deduction).
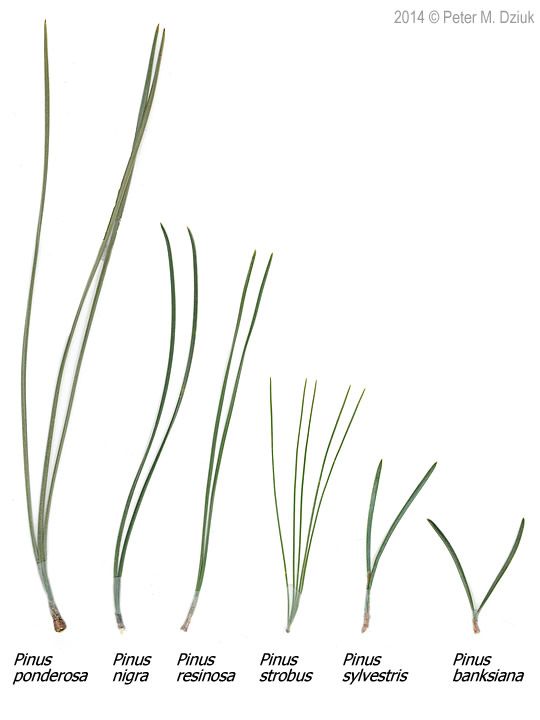
Pine needles on the north/shady side of a tree vs. the south/sunny side:
Note
📖 New words

Important
Dependent vs. independent variables
Tip
🖐 Today in the field
Each group collects needles from the shady side and the sunny side of the same trees, using one agreed-on method — same height, same “mature needle” definition, same spot on the branch.
We are going to the field to collect pine needles - easy but yes… and then come back, decide how to measure, measure them, enter data in excel
length_mm, not Length (mm) — no spaces, no units hidden in the header text or variable names, all lowercaseNote
✅ Key idea
A few minutes of naming discipline today saves hours of confusion in Wrangling Your Data, when we clean messy data.
Tip
Controlled vocabulary example
| Bad | Good |
|---|---|
Needle Length |
length_mm |
N/S |
n_s |
Sun Exposure |
sun |
pine_project/
├── data/ ← raw files, never overwritten
├── scripts/ ← your .R code
├── figures/ ← plots you save
└── output/ ← place to save modified data
C:/Users/.../Desktop/final_FINAL2.xlsxNote
✅ Key idea
Keep raw data untouched.
R writes new, processed files — so you can always trace your steps back to the original numbers.
Note
📖 New word
Metadata = data about your data: who collected it, when, how, with what instrument.
Without it, data are nearly useless — even to future-you.
Tip
🖐 Preview
Tidy data — one row per observation, one column per variable — is the target we’re organizing toward. We’ll formalize this in Wrangling Your Data.
| Pane | Where | What it does |
|---|---|---|
| Editor | top-left | your scripts live here |
| Console | bottom | where code actually runs |
| Environment | right | everything you’ve stored |
| Plots / Files | right | figures and project files |
Note
📖 New word
IDE = Integrated Development Environment. R is the car engine; Positron is the seat, wheel, and dashboard.
Type math into the console and press Enter:
To keep a value, give it a name with the assignment operator <-:
Warning
⚠️ Watch out!
R is case-sensitive: x and X are different objects. Use <-, not =, to assign.
Note
📖 New word
Object = a named container holding a value. Look for it appear in the Environment pane the moment you create it.
lower_snake_case: needle_length, not x2 or NeedleLength# is a comment — a note for humans, ignored by RA function takes arguments in () and returns a result. Stuck? Ask for help:
Tip
🖐 Try it yourself
Predict what round(3.14159, 2) returns before you run it.
Note round in R works odd and you should use round_half_up from janitor
Note
📖 New words
A vector is a row of values made with c() — a spreadsheet column is really just a vector:
The console forgets. A script (.R file) remembers:
Warning
⚠️ Watch out!
Without quotes, s means “find an object called s,” not the text “s.”
R will error if no such object exists.
Note
✅ Key idea
Console = scratch paper.
Script = the lab notebook you keep and rerun.
Install once, in the console:
Load every session, at the top of every script:
Warning
⚠️ Watch out!
“could not find function…” almost always means you forgot the library() line for that session.
Note
📖 New words
Put the file in data/, then:
Note
✅ Key idea
read_csv() comes free with library(tidyverse). Your file’s first row becomes the column names in R.
Note
Our columns
n_s — "n" (north/sheltered) or "s" (south/exposed)sun — "shady" or "sunny", same grouping said a different waylength_mm — needle length in millimetersRows: 48
Columns: 6
$ date <chr> "3/20/25", "3/20/25", "3/20/25", "3/20/25", "3/20/25", "3/20…
$ group <chr> "cephalopods", "cephalopods", "cephalopods", "cephalopods", …
$ n_s <chr> "n", "n", "n", "n", "n", "n", "s", "s", "s", "s", "s", "s", …
$ sun <chr> "shady", "shady", "shady", "shady", "shady", "shady", "sunny…
$ tree_no <dbl> 1, 1, 1, 1, 1, 1, 1, 1, 1, 1, 1, 1, 2, 2, 2, 2, 2, 2, 2, 2, …
$ length_mm <dbl> 20, 21, 23, 25, 21, 16, 15, 16, 14, 17, 13, 15, 19, 18, 20, …
Tip
🖐 Notice
n_s and sun always travel together — n with shady, s with sunny. Two columns encoding the same grouping. Useful redundancy, or something to simplify? We’ll revisit this in Wrangling Your Data.
Warning
⚠️ Watch out!
If a number column shows as <chr> in glimpse(), a stray letter or comma is hiding in that column.
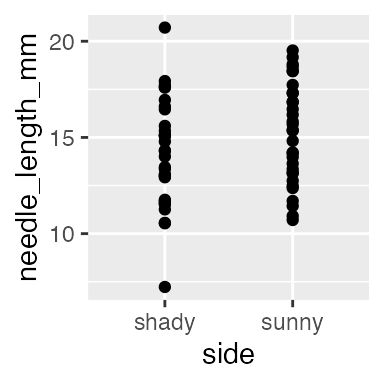
ggplot, built in layersEvery ggplot needs three things, joined with +:
Warning
⚠️ Watch out!
+ sits at the end of a line, never the start.
this is what adds layers to the plot and order matters
Note
✅ Key idea
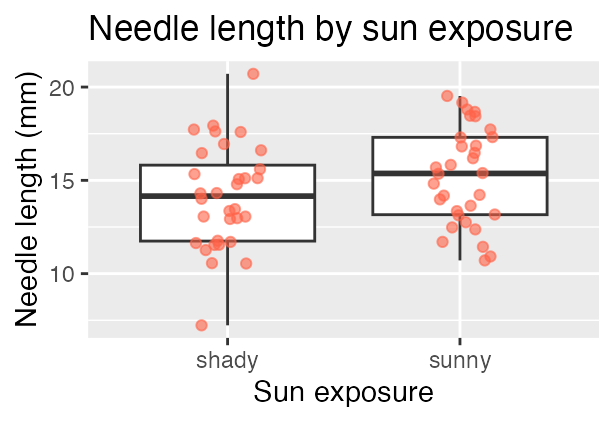
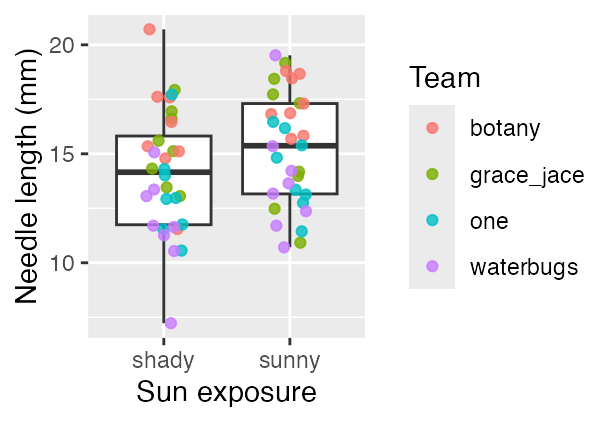
Seeing your data is the single most important habit in this course — before you summarize or test anything, plot it.

Tip
🖐 Try it yourself
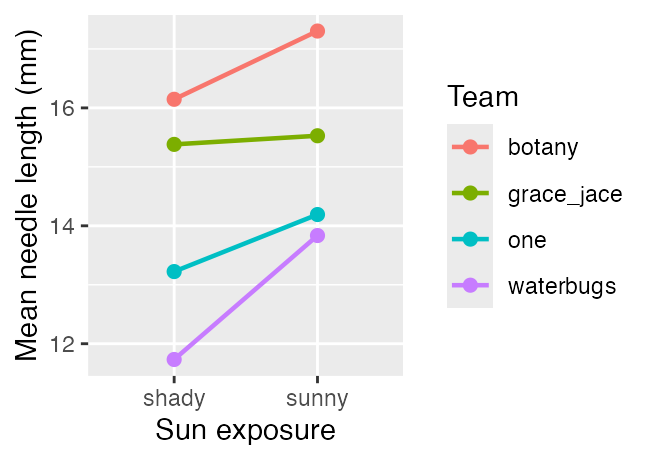
Swap sun for group. What does that plot tell you instead?
Note
✅ Key idea
A boxplot shows the summary; the jittered points show every real value underneath it. Show both when you can.
Warning
⚠️ Watch out!
ggsave() wants the filename first, then plot =. Always use dpi = 300 — print/poster quality.
Note
📖 File format tip
Save figures as PNG for reports and submissions.
Today you:
ggplotTip
🖐 Before next class
Finish the worksheet: load pine_needles.csv, run glimpse(), and make one more plot — length_mm by n_s this time. Save it to figures/.
Note
Up next — Wrangling Your Data
filter(), select(), mutate(), arrange()|> and building a pipelineWhen code breaks — and it will, that is normal:
library(tidyverse) loaded? Spelling? A missing ) or + at the start of a line??function_name opens the help pageNote
✅ Key idea
Every working scientist googles error messages daily. Getting stuck is not failing — it is the job.