01_Homework_intro
Homework for Week 1:
This is an assignment for you to practice the code and all the work we do in class on a different dataframe with a few twists to challenge you a bit. We will assign one of these each week for you to do that encompasses all fo the work we do. We give it out on Monday so you can start early and build on it during class.

Objectives and goals
Overall, I want you to be able to set up a project in RStudio, organize the data and scripts, read in the data, and visualize the data and save the output to a pdf file.
Make a new Project in RStudio.
Create directories
- data, scripts, output, figures, documents
Create a quarto markdown file and open it
Put this in the top in place of what is there and add your info
---
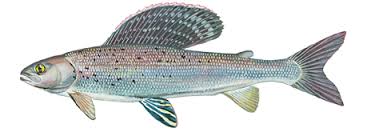
title: "Grayling in Lake I-8" # Title of the file
author: "YOUR NAME" # who you are
execute:
freeze: auto
cache: true
echo: true
keep-md: true # retains the images when you start again
fig-width: 3
fig-height: 4
format:
html:
toc: false
output-file: "01_03_homework_html.html"
self-contained: true
number-sections: false
embed-resources: true
---- Load the libraries
# Load the libraries ----
library(readxl) # allows to read in excel files
library(tidyverse) # provides utilities seen in console- Read in the file
gray_I3_I8.csvas a dataframe - Read in the file
gray_I3_I8``.xlsxas a separate dataframe - Annotate your code in the code block as what what is going on and why
- Annotate the HTML code as you see fit.
- Visualize the data as the lengths of fish in lakes I_3 and I_8 as points
- remember
position = position_dodge2(width=0.2)
- remember
- Visualize the data as box and whisker plots
- Provide summary statistics grouped by lake- can use skimr if you want
- n, mean, standard deviation, standard error
- Visualize the data as mean plus or minus error in ggplot
- be sure to have proper axis labels and units where necessary
Submission Guidelines
What to turn in -
a quarto markdown file. Note that your code should be able to run with what you turn in.
a self-contained word or html file showing the code and output
annotations in the quarto file that shows or tells what is being done in the r code chunks describing what you are trying to do - credit will be given even if it does not work as long as you detail what you are doing. As we start to move into more statistics you will be expected to interpret the results.
Points
- summary stats - 10 points
- exploratory graphs - 10 point