Lecture — One-Factor ANOVA II: Wētā, and Correcting for Size
The same eight steps, and the moment they give you the wrong answer
anova
emmeans
car
performance
factors
statistics
new zealand
A second pass at one-factor ANOVA on New Zealand tree wētā, whose adult males come in three discrete morphs. We re-run last class’s eight-step recipe on foreleg length, meet two traps the possums never showed us — a circular response variable and a grouping variable confounded with body size — and then watch a hugely significant result on ear size collapse to nothing once ear is measured relative to body size. Finishes by bringing the females back as a fourth group, and on how to report a non-significant ANOVA honestly.
Author
Bill Perry
Published
November 10, 2026
Where We Left Off — Possums
Eight steps, and you now know all of them:
factor() the groups
Plot it, and predict the answer
lm()
Anova(type = 2)
check_model() + leveneTest() + shapiro.test()
eta_squared()
emmeans() → pairs() → cld()
Write the sentence
Note
✅ Transition
Today we run that exact recipe on a different animal — and it hands us an answer that is statistically perfect and biologically wrong. 🦗
Goals for Today
Run the eight steps on three wētā morphs
Spot a response variable that is circular — the answer baked into the labels
Spot a grouping variable confounded with body size
Fix it with one mutate(), and watch a result vanish
Report a non-significant ANOVA properly
Bring the females back as a fourth group
Tools today:
Nothing new 🎉
Same five packages as last class
Data: 🦗 313 wētā, Te Pākeka / Maud Island, New Zealand
Tip
Four chunks: recap → the ears → the correction → the females.
Meet the Wētā 🦗
Wellington tree wētā, Hemideina crassidens — a large, flightless, nocturnal relative of crickets, found only in New Zealand.
Lives in galleries chewed into dead wood
A male defends a gallery holding several females
Big enough to sit in your palm, and it will bite
313 adults were collected at night on Te Pākeka / Maud Island in March and April 2016, and 11 body parts were measured on each one.
Note
📖 Why wētā
New Zealand has almost no native land mammals. Insects took the roles mammals take elsewhere — and got big doing it.
Wētā are what happens to a cricket when nothing is hunting it from the ground.
Three Kinds of Adult Male
Wētā males stop growing at the 8th, 9th or 10th instar — three discrete adult forms, not a smooth gradient:
eighth — small head, small jaws. Sneaks into another male’s gallery
ninth — intermediate
tenth — enormous head and mandibles. Fights for galleries and holds harems
Three strategies for the same job, living side by side in the same forest.
Tip
🧪 One factor, three levels
Response: a body measurement — a number
Factor:morph — three groups
Exactly last class’s design. The animals are stranger; the test is identical.
🧩 Chunk 1 of 4 · The Recipe Again — and Two Traps
We will cover: why we drop the females, why head_length is off-limits, and the eight steps on foreleg length.
There are four groups in that file — and 118 of the 313 animals are female.
Females are much smaller than every male morph. Leave them in and the ANOVA will come back wildly significant, driven almost entirely by sex, and the three male morphs get buried.
Our question is “do the three male morphs differ?” — so the data has to be the three male morphs.
Warning
⚠️ The data must match the question
filter() is not housekeeping. It is where you decide what your test is about.
We will bring the females back in Chunk 4, on purpose, and ask a different question.
Trap 2: head_length Is Circular
The three morphs were defined using head length. From the data’s own documentation:
eighth — male, head_length < 18.51
ninth — male, 18.51 to 24.15
tenth — male, head_length > 24.15
So “does head length differ among morphs?” is guaranteed. The answer was built into the labels.
You would get an enormous F and learn nothing.
Important
⚠️ Circular reasoning, in code
If the grouping variable was made from the response variable, the test is meaningless.
Nothing in R will stop you. Anova() will hand you p < 2e-16 and a gold star.
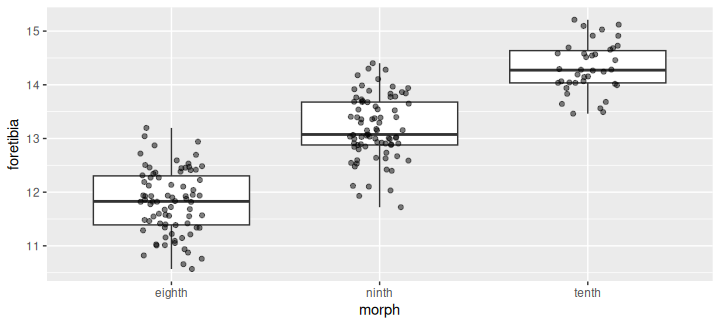
 morph  emmean     SE  df lower.CL upper.CL .group
 eighth   11.8 0.0644 192     11.7     11.9  a
 ninth    13.2 0.0640 192     13.1     13.3   b
 tenth    14.3 0.0922 192     14.1     14.5    c

Confidence level used: 0.95
P value adjustment: tukey method for comparing a family of 3 estimates
significance level used: alpha = 0.05
NOTE: If two or more means share the same grouping symbol,
      then we cannot show them to be different.
      But we also did not show them to be the same.
Note
✅ a, b, c — all three separate
F(2, 192) = 268.5, p < 0.001, η² = 0.74. Morph explains 74% of the variation in foreleg length, and every morph is distinguishable from every other.
Cleanest result you will ever see. Which is exactly when you should get suspicious.
🧩 Chunk 2 of 4 · The Ears
We will cover: how a wētā hears, and a result that looks like a discovery.
Wētā Hear Through Their Knees
A wētā has no ears on its head. It hears through a tympanic membrane on the foreleg tibia — a drum on the knee.
Our file has that membrane’s area, in mm², as ear.
So we can ask a real behavioural question:
The sneaks have to listen for the fighters. Do the three morphs differ in ear size?
Tip
🧪 Why this is a good question
The three morphs play different games.
A sneak that hears a resident male coming survives. A fighter does not need to sneak.
If hearing mattered differently to them, you might see it in the hardware.
Same Recipe, New Response
ear_model <-lm(ear ~ morph, data = weta_df)Anova(ear_model, type =2)
Anova Table (Type II tests)

Response: ear
          Sum Sq  Df F value    Pr(>F)
morph     23.143   2  122.19 < 2.2e-16 ***
Residuals 18.183 192
---
Signif. codes:  0 '***' 0.001 '**' 0.01 '*' 0.05 '.' 0.1 ' ' 1
eta_squared(Anova(ear_model, type =2), partial =FALSE)
# Effect Size for ANOVA (Type II)

Parameter | Eta2 |       95% CI
-------------------------------
morph     | 0.56 | [0.49, 1.00]

- One-sided CIs: upper bound fixed at [1.00].
 morph  emmean     SE  df lower.CL upper.CL .group
 eighth   2.50 0.0348 192     2.44     2.57  a
 ninth    2.98 0.0346 192     2.92     3.05   b
 tenth    3.42 0.0499 192     3.33     3.52    c

Confidence level used: 0.95
P value adjustment: tukey method for comparing a family of 3 estimates
significance level used: alpha = 0.05
NOTE: If two or more means share the same grouping symbol,
      then we cannot show them to be different.
      But we also did not show them to be the same.
Important
📣 A headline result
F(2, 192) = 122.2, p < 0.001, η² = 0.56. All three morphs separate: a, b, c.
Ear area climbs 2.50 → 2.99 → 3.42 mm². Morph explains 56% of the variation.
Assumptions pass. Write the paper: “the fighting morph has a 37% larger hearing organ.”
Stop
Before you write that sentence, look back at the table from Chunk 1.
Mean pronotum — body size — by morph:
eighth6.37 mm
ninth6.93 mm
tenth7.52 mm
The tenth-instar males have bigger ears. They also have bigger everything. They are bigger animals.
Warning
⚠️ What did we actually test?
We asked: do the morphs differ in ear size? → Yes.
We wanted to ask: do the morphs differ in hearing?
Those are not the same question, and Anova() cannot tell them apart.
🧩 Chunk 3 of 4 · The Correction
We will cover: one mutate(), a units problem, and a result that disappears.
Measure the Ear Relative to the Animal
The fix is to divide ear size by body size — but there is a units problem first.
ear is an area, in mm²
pronotum is a length, in mm
Dividing an area by a length is meaningless. So first take the square root of the area, which turns it back into a length, and then divide:
ear_rel =sqrt(ear) / pronotum
Now it is a length over a length — a ratio, with no units at all.
Note
📐 Check your units
This is the oldest trick in quantitative biology and it catches errors nothing else catches.
If the units of your answer are nonsense, the answer is nonsense — however good the p-value looks.
 morph  emmean      SE  df lower.CL upper.CL .group
 tenth   0.246 0.00205 192    0.242    0.250  a
 eighth  0.249 0.00143 192    0.246    0.251  a
 ninth   0.249 0.00142 192    0.246    0.252  a

Confidence level used: 0.95
P value adjustment: tukey method for comparing a family of 3 estimates
significance level used: alpha = 0.05
NOTE: If two or more means share the same grouping symbol,
      then we cannot show them to be different.
      But we also did not show them to be the same.
Note
All three share the letter a.
Same ears. Same animals. Two defensible analyses. Opposite conclusions.
p < 0.001 → p = 0.449 on one mutate().
What Changed, and What Did Not
Both results are correct. They answer different questions:
Raw ear answers: “is a tenth-instar male’s hearing organ physically bigger?” → Yes, clearly.
Relative ear answers: “has the hearing organ been scaled up more than the rest of the animal?” → No.
A tenth-instar male has a bigger ear for exactly the reason it has a bigger leg: it is a bigger wētā.
Warning
⚠️ Which would you report?
For a paper about hearing, the relative one — the raw result would overstate the finding badly.
For a paper about how big the organ is, the raw one.
Neither is a trick. You have to say which question you asked.
How to Report a Non-Significant ANOVA
Important
📝 Say it with the same confidence
Relative tympanic membrane size did not differ detectably among the three male morphs (one-way ANOVA, F(2, 192) = 0.80, p = 0.449, η² = 0.008), with homogeneous variances (Levene’s test p = 0.59) and normally distributed residuals (Shapiro–Wilk p = 0.50). Raw membrane area did differ (F(2, 192) = 122.2, p < 0.001), but so did body size, and the difference did not survive scaling.
Three Rules for a Null Result
Report the numbers anyway. F, both df, p, and η². “Not significant” on its own is not a result
Say it with the assumption checks. A null from a model that passes its checks means something. A null from a broken model means nothing
Never write “no difference.” Write “no detectable difference”, or “we did not detect a difference”
Warning
⚠️ Absence of evidence
Remember cld()’s own note from last class:
we cannot show them to be different — but we also did not show them to be the same
With n = 38 in the smallest group, a small real difference would have slipped past us. Saying so is part of the result.
🧩 Chunk 4 of 4 · Bring the Females Back
We will cover: four groups instead of three, and a ladder that stops short.
A Different Question Needs Different Data
In Chunk 1 we dropped the females because they would swamp a question about male morphs.
Now we ask a question they belong in:
Across all four adult forms, is the foreleg scaled up differently?
The foreleg is the weapon — a tenth-instar male fights with it. If it has been built up beyond general body size, relative foreleg length should separate the groups.
Tip
🎯 Same correction, new trait
fore_rel = foretibia / pronotum
Both are lengths in mm, so no square root this time. Just divide.
 morph  emmean      SE  df lower.CL upper.CL .group
 female   1.65 0.00654 309     1.64     1.67  a
 eighth   1.86 0.00805 309     1.84     1.87   b
 ninth    1.90 0.00800 309     1.89     1.92    c
 tenth    1.90 0.01150 309     1.88     1.93    c

Confidence level used: 0.95
P value adjustment: tukey method for comparing a family of 4 estimates
significance level used: alpha = 0.05
NOTE: If two or more means share the same grouping symbol,
      then we cannot show them to be different.
      But we also did not show them to be the same.
Important
a | b | c | c
F(3, 309) = 266.3, p < 0.001, η² = 0.72, both assumptions passing.
Females, then eighth, then ninth — all separate. But ninth and tenth share c: 5 of the 6 pairs are significant, and that one is not.
Relative foreleg length rises steeply, then plateaus.
What That Plateau Means
This result survived the body-size correction — unlike the ears. The foreleg really has been built up more than the animal as a whole.
But it stops. Going from ninth to tenth instar makes a wētā bigger without making its foreleg relatively longer again.
Whatever the tenth-instar morph is doing differently, by that point it is doing it with overall size, not with leg proportion.
Warning
⚠️ And the honest caveat
n = 38 for the tenth morph.
ninth and tenthsharing a letter is a failure to detect a difference. With 380 tenth-instar males it might well split.
Say that, then stop.
Your Homework
Do today over again on the hind leg — hindtibia, the jumping leg, not the weapon.
Run the eight steps on rawhindtibia
Then on hindtibia / pronotum
Report both, and say what changed
Note
It will not come out like the ears.
The ears went from p < 0.001 to p = 0.449 — all the way to nothing. The hind leg does something in between. Your job is to describe it, not to match today’s answer.
Tip
🎯 One optional extra
A section on eye, where the raw analysis fails its normality check and the relative one passes.
Sometimes the right question is also the better-behaved model. Not always. But sometimes.
Recap
The data must match the question — filter() decides what your test is about
A circular response is meaningless — head_lengthdefined the morphs, so never test it
Raw size differences mostly measure body size. Divide by a body-size measure and ask again
Check your units — ear is an area, so sqrt() before dividing by a length
Ears:p < 0.001 → p = 0.449. Same data, one mutate(), opposite conclusion
Forelegs: the difference survived the correction — then plateaued between ninth and tenth