Six numbers per Pokémon, one picture, and what ‘variance explained’ means
pca
multivariate
prcomp
ggplot
pokemon
A first, gentle pass at principal component analysis, assuming no statistics background at all. Why six correlated measurements are hard to look at, what PCA actually does (the shadow analogy), why you must scale first, running prcomp(), reading summary() for variance explained, building a scree plot, deciding how many components to keep, and checking that PC1 means something real by looking at which Pokemon sit at each end of it.
Author
Bill Perry
Published
November 10, 2026
Something Completely Different
Everything this term had one response variable.
A t-test: one measurement, two groups
Regression: one measurement against one other
ANOVA: one measurement across several groups
Note
✅ Transition
Today: six measurements at once, and no groups to compare. Not “is A different from B?” but “what is the shape of this whole dataset?” 🔴
Today Has No p-Values
PCA is not a test. There is nothing to reject.
No null hypothesis
No p-value
No assumptions to check
Nothing passes or fails
It is a way of looking at data that has too many columns to plot.
So the question today is never “is it significant?” It is always “does this make sense?”
Important
⚠️ Set down one habit
For nine weeks, “did it work?” meant “is p small?”
Today you judge your result by whether you can explain what the axes mean.
That is a harder standard, not an easier one.
Goals for Today
See why six columns are hard to look at
Notice that the columns are correlated
Understand what PCA does — in words, not algebra
Know why you must scale first
Run it: prcomp()
Read variance explained from summary()
Draw a scree plot and decide how many axes to keep
Sanity-check PC1 against things you already know
Tools today:
tidyverse — that is it
Data: 🔴 the original 151 Pokémon, six battle stats each
Tip
No new packages.prcomp() is built into R.
Why Pokémon
Because you can check the answer.
PCA will hand back new axes it invented, and you have to decide whether they mean anything. That is nearly impossible to judge on unfamiliar data.
But if an axis puts Magikarp at one end and Mewtwo at the other, you know exactly what it found.
The method is the same one used on gene expression, soil chemistry, and skull measurements. Only the checking is easier.
Note
📖 The six stats
hp — hit points
attack — physical attack
defense — physical defence
sp_attack — special attack
sp_defense — special defence
speed — speed
Game-design numbers, but they behave exactly like six measurements off an animal.
🧩 Chunk 1 of 4 · The Problem With Six Columns
We will cover: reading the data, and why you cannot just plot it.
Three → an awkward 3-D scatterplot nobody can read.
Six → nothing. There is no six-dimensional plot, and there never will be.
You could draw all the pairs instead. Six columns make 15 pairwise scatterplots, and no one can hold 15 plots in their head at once.
Warning
⚠️ The real problem
It is not that drawing is hard.
It is that “which Pokémon are similar to each other?” is a question about all six numbers at the same time, and looking at them two at a time cannot answer it.
PCA chases spread. Hand it unscaled columns and it will decide the most important thing in the data is whichever column happens to use the biggest numbers.
Warning
⚠️ A worked disaster
Imagine measuring animals in grams and kilometres.
Body mass in grams: thousands. Home range in km: maybe 0.4.
Unscaled, PC1 would be entirely mass, and would tell you nothing except which unit you typed.
Scaling, In One Argument
scale. = TRUE converts every column to standard deviations from its own mean before doing anything else.
After scaling, every column has:
mean 0
standard deviation 1
Now all six compete fairly, and the units cancel out entirely.
Important
⚠️ Mind the full stop
The argument is scale. — with a dot:
prcomp(poke_stats, scale. =TRUE)
The dot is there because scale was already an R function. Leave it off and you get an error.
Almost always use scale. = TRUE.
🧩 Chunk 3 of 4 · Run It and Read It
We will cover:prcomp(), summary(), variance explained, and the scree plot.
One Line
poke_pca <-prcomp(poke_stats, center =TRUE, scale. =TRUE)
Note
🧠 That is the entire analysis
center = TRUE — subtract each column’s mean
scale. = TRUE — divide by each column’s standard deviation
Everything from here on is reading the result, which is the part that takes judgement.
What Came Back
summary(poke_pca)
Importance of components:
                          PC1    PC2    PC3    PC4     PC5
Standard deviation     1.5418 1.1349 0.9943 0.8280 0.58318
Proportion of Variance 0.3962 0.2147 0.1648 0.1143 0.05668
Cumulative Proportion  0.3962 0.6109 0.7756 0.8899 0.94655
                           PC6
Standard deviation     0.56630
Proportion of Variance 0.05345
Cumulative Proportion  1.00000
Reading summary() — the Only Row That Matters
Ignore the first row. Read these two:
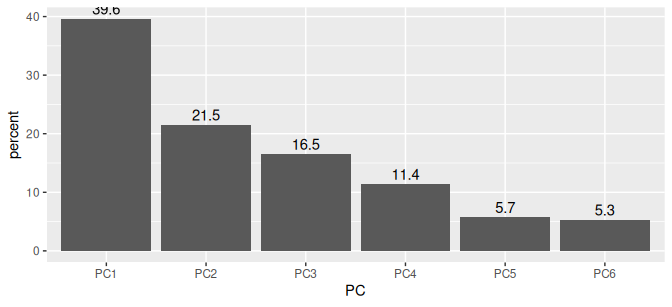
Proportion of Variance — how much of the total spread each PC captures:
PC1: 39.6%
PC2: 21.5%
PC3: 16.5%
Cumulative Proportion — the running total:
PC1 alone: 39.6%
PC1 + PC2: 61.1%
All six: 100%, always
Important
✅ The headline
Two invented axes carry 61% of everything in six columns.
So a flat scatterplot of PC1 against PC2 — which we draw next class — shows you about three-fifths of the whole dataset.
That is the payoff.
“Variance Explained”, In Plain Words
Variance here just means how spread out things are.
Total variance = every way these 151 Pokémon differ from each other across all six stats.
PC1 captures 39.6% of that. Meaning: if you threw away all six stats and kept only each Pokémon’s PC1 score, you would still have about 40% of the information about how they differ.
One number instead of six, for 40% of the picture.
Warning
⚠️ Not 39.6% of the Pokémon
And not 39.6% accuracy.
It is 39.6% of the total variation — of the differences between them.
If every Pokémon had identical stats there would be no variance at all, and PCA would have nothing to find.
✅ Look at the PC1 column: every single number is positive
So a Pokémon scores high on PC1 by being high on all six stats at once.
PC1 is an “overall power” axis. We will take this table apart properly next class — for now, notice that PC2 has minus signs, which means it is doing something completely different.
Top of PC1: Mewtwo, Dragonite, Mew, Articuno, Zapdos, Moltres — every legendary in the game, plus the two strongest non-legendaries.
Bottom of PC1:Magikarp, Caterpie, Weedle, Metapod, Kakuna, Zubat.
Nobody told PCA which Pokémon were strong. There is no “power” column in the file. It was handed six columns of numbers and it sorted them by overall strength on its own.
Important
✅ Why this matters beyond Pokémon
This is the check you run on every PCA.
You cannot test whether an axis is “real”. But you can look at what sits at each end and ask whether it lines up with something you already know.
If it does, the axis is measuring something. If it does not, be very careful.
# A tibble: 2 × 3
  is_legendary     n mean_PC1
  <lgl>        <int>    <dbl>
1 FALSE          147    -0.08
2 TRUE             4     3
Note
The four legendaries average PC1 = 3.00; everyone else averages −0.08.
PC1 scores are in standard deviations, so the legendaries sit about three standard deviations above the crowd — on an axis that was built without ever being told they existed.
What We Have, and What Is Missing
We have:
Two axes holding 61% of six columns
PC1 identified as “overall power”, checked against Magikarp and Mewtwo
We do not have:
Any idea what PC2 means
A picture — we have not plotted a single Pokémon yet
Any way to see the original six stats on that picture
All three are next class.
Tip
🎯 A hint about PC2
Look back at the loadings. In PC2, defense is +0.59 and speed is −0.54.
A big positive and a big negative on the same axis means PC2 is a trade-off, not a total.
Which trade-off? Next class.
Your Homework
Do today again on all 1,025 Pokémon instead of the original 151.
data/pokemon_1025.csv has the identical columns, so the homework is mostly changing one filename and re-reading your output.
The real question: does PC1 still mean the same thing? Twenty-five years of new Pokémon, nine generations — or is “overall power” just a quirk of the first 151?
Note
📂 What you will do
The whole chunk-1-to-4 sequence on the bigger file, then compare your percentages and your top/bottom lists to today’s.
All the code is in the homework file. Most of the marks are for reading what comes out.
Recap
PCA is not a test — no p-value, no assumptions, nothing to reject
It exists because six columns cannot be plotted, and pairs cannot answer “who is similar to whom”
It works because the columns are correlated — correlation is redundancy
Think shadows: a lower-dimensional view, taken from the most informative angle
Always scale. = TRUE, or the column with the biggest numbers wins by default
prcomp() is one line; reading it is the work
PC1 = 39.6%, PC2 = 21.5%, together 61.1% of everything in six columns
The scree plot shows where to stop; there is no rule, only judgement
Validate by looking at the ends. Magikarp at one end, Mewtwo at the other ✅
Note
✅ Next
Open the activity and run it. Next class: what PC2 means, and the picture. 🔴