Seven sites, one question: do these possums differ in size?
anova
emmeans
car
performance
factors
statistics
kaggle
One factor, more than two groups, done properly from end to end on real data found on Kaggle: 104 Australian brushtail possums trapped at seven forest sites. Why one test instead of twenty-one t-tests, naming and ordering groups with factor(), fitting lm() and reading car::Anova(type = 2), checking the assumptions AFTER the fit with performance::check_model() and car::leveneTest(), measuring how big the effect is with eta-squared, and finding out WHICH sites differ with emmeans and compact letter displays.
Author
Bill Perry
Published
November 10, 2026
Where We Left Off — Two Groups
A t-test compared two group means
lm() fit a model and gave us slopes and intercepts
A factor let us decide what order groups sit in
And every time, we checked whether the test was allowed before we believed it
Note
✅ Transition
Today the question is the same shape — do these groups differ? — but there are seven groups, not two. That one change breaks the t-test, and the thing that replaces it is ANOVA. 🐾
Goals for Today
See why twenty-one t-tests is the wrong answer
Look at the data before testing anything
Use factor() to give groups names and an order
Fit with lm(), test with car::Anova(type = 2)
Check the assumptions after the fit:
performance::check_model()
car::leveneTest()
Say how big the effect is with eta-squared
Find out which groups differ — emmeans + letters
Write the result up in a sentence a reader can use
Tools today:
tidyverse
car — Anova(), leveneTest()
performance — check_model()
emmeans — follow-up tests
multcomp — the letters
Data: 🐾 104 brushtail possums, 7 sites, off Kaggle
Tip
Five chunks: why → look → test → check → which.
How to Use These Slides
Five short chunks. After each one you switch to the activity and run the code yourself.
Every line is already written for you. Your job is to run it, read the output, and argue with it.
⚠️ Those are numbers, and R will treat them as numbers
site arrives as the integers 1–7. To R that is a quantity — as if site 6 were “twice site 3”. It is not. It is a name that happens to be written with a digit.
Leave it like this and lm() will fit a straight line through site number, which is nonsense.
The two lists must be the same length and in the same order. Get the order wrong and every single result is quietly mislabelled — no error, no warning.
The site names come from the OpenIntro codebook. We did not invent them.
Note
📋 The seven sites
Victoria: Cambarville, Bellbird
New South Wales: Whian Whian, Byrangery
Queensland / N. NSW: Conondale, Allyn River, Bulburin
Warning
⚠️ Unequal groups
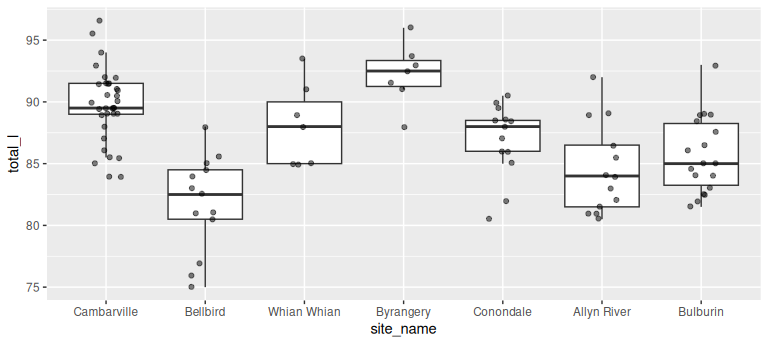
33 possums at Cambarville, 7 at Byrangery. That is fine for ANOVA — but it is why we will not hand-calculate anything.
First 8 of 21 rows. Tukey widens every p-value to pay for running 21 tests.
The Count
Of the 21 pairs, 10 are significant and 11 are not.
Which is exactly what the boxplot predicted:
Everything involving Bellbird (lowest) or Byrangery (highest) tends to separate
The middle five mostly do not separate from each other
Twenty-one rows is a lot to read. There is a better way to show it.
Tip
🎯 Report the pattern
Nobody wants 21 p-values in a results section.
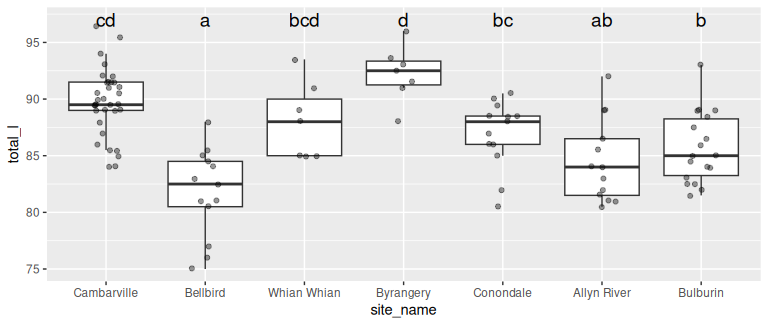
They want to know which groups cluster together. That is what letters do.
Compact Letter Display
cld(site_means, Letters = letters)
 site_name   emmean    SE df lower.CL upper.CL .group
 Bellbird      81.8 0.893 97     80.0     83.5  a
 Allyn River   84.5 0.893 97     82.8     86.3  ab
 Bulburin      85.7 0.759 97     84.2     87.2   b
 Conondale     86.9 0.893 97     85.2     88.7   bc
 Whian Whian   88.1 1.220 97     85.7     90.5   bcd
 Cambarville   89.7 0.561 97     88.6     90.8    cd
 Byrangery     92.2 1.220 97     89.8     94.7     d

Confidence level used: 0.95
P value adjustment: tukey method for comparing a family of 7 estimates
significance level used: alpha = 0.05
NOTE: If two or more means share the same grouping symbol,
      then we cannot show them to be different.
      But we also did not show them to be the same.
How to Read Letters
Share a letter → not shown to differ. No letter in common → differ.
Bellbirda — alone at the bottom
Allyn Riverab — not distinguishable from either neighbour
Byrangeryd — alone at the top
Bellbird vs Byrangery: a vs d, nothing shared → differ
A clean ladder from 81.8 cm up to 92.2 cm.
Warning
⚠️ Read R’s own note
“If two or more means share the same grouping symbol, then we cannot show them to be different. But we also did not show them to be the same.”
Sharing a letter is failure to detect a difference — not evidence of equality. Especially at Byrangery, where n = 7.
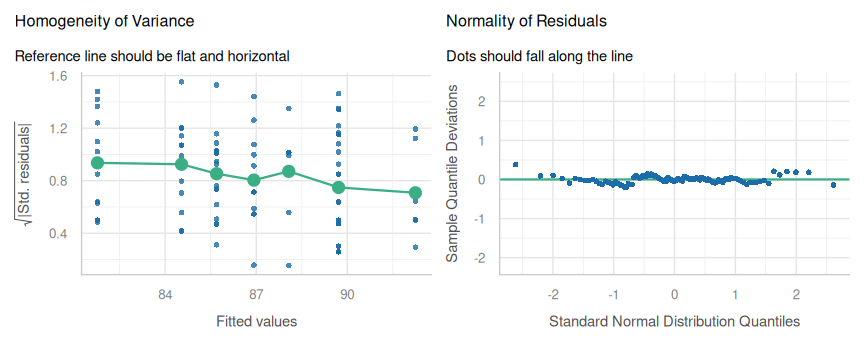
Total length differed significantly among the seven trapping sites (one-way ANOVA, F(6, 97) = 14.58, p < 0.001), and site accounted for 47% of the variation in length (η² = 0.47). Residuals were normally distributed (Shapiro–Wilk p = 0.59) with homogeneous variances across sites (Levene’s test p = 0.81). Tukey-adjusted comparisons separated Bellbird (mean 81.8 cm) from Byrangery (92.2 cm), with the remaining five sites forming an overlapping middle group.
What Belongs in That Sentence
Every number has a job:
The test — one-way ANOVA
F with both df — F(6, 97); the df let a reader reconstruct your design
p — as p < 0.001, not p = 0
Effect size — η², because p alone hides size
Assumption checks — so the reader knows you looked
The pattern — which groups, in which direction, with means
Warning
⚠️ Never write “p = 0.000”
Software rounds. Probability does not reach zero.
Write p < 0.001 and move on.
Common Ways This Goes Wrong
Grouping variable left as a number → you fit a line through site IDs
Reading summary() instead of Anova() → six wrong p-values
Checking assumptions before fitting → there are no residuals yet
Expecting a small p for Levene → backwards
Stopping at a significant F → F never says which groups
Unadjusted pairwise tests → the 66% problem, straight back
Calling shared letters “the same” → they are undetected, not equal
Tip
🎯 The recipe, memorised
factor() the groups
Plot it
lm()
Anova(type = 2)
check_model() + leveneTest()
eta_squared()
emmeans() → pairs() → cld()
Write the sentence
Your Homework: The Same Possums, a Different Ruler
The file has four measurements on every animal. We used total_l. For homework you run the whole recipe again on tail_l — tail length.
Same 104 animals, same seven sites, same eight steps. A different ruler.
The question is whether the pattern holds: do the sites that had the longest bodies also have the longest tails?
Note
📂 What you will do
All eight steps on tail_l, then one paragraph comparing your letters to the ones we got today.
Plus one optional part where an assumption fails on purpose.
And a Preview of Next Class 🦗
Next time: New Zealand tree wētā, a large flightless cricket relative whose adult males come in three distinct forms — small-jawed sneaks, intermediates, and huge-jawed fighters.
We will find that the three forms differ enormously in ear size.
Then we will divide ear size by body size, run the identical test, and the answer will change.
Tip
🎯 Why that matters
ANOVA answers the question you asked it.
Making sure that is the question you meant is the whole job of next class.