| side | n | mean_wt | sd_wt | se_wt |
|---|---|---|---|---|
| shady | 10 | 7.8 | 1.03 | 0.33 |
| sunny | 10 | 3.8 | 0.79 | 0.25 |
Leaf Morphology: Sunny vs. Shady Sides of a Tree
A reproducible report built in Quarto
Introduction
Leaves on the shady side of a tree may grow larger to capture more of the limited light. In this study we measured leaf weight on the sunny and shady sides of a tree and tested whether the two sides differ.
- Null hypothesis (H₀): there is no difference in mean leaf weight between sides.
- Alternate hypothesis (Hₐ): mean leaf weight differs between sides.
Methods
We recorded the weight (g) of leaves sampled from each side of the tree. All analysis was done in R with the tidyverse, and this report was produced in Quarto so that every number and figure below is computed directly from the raw data.
Results
Table 1 shows the summary statistics for each side of the tree.
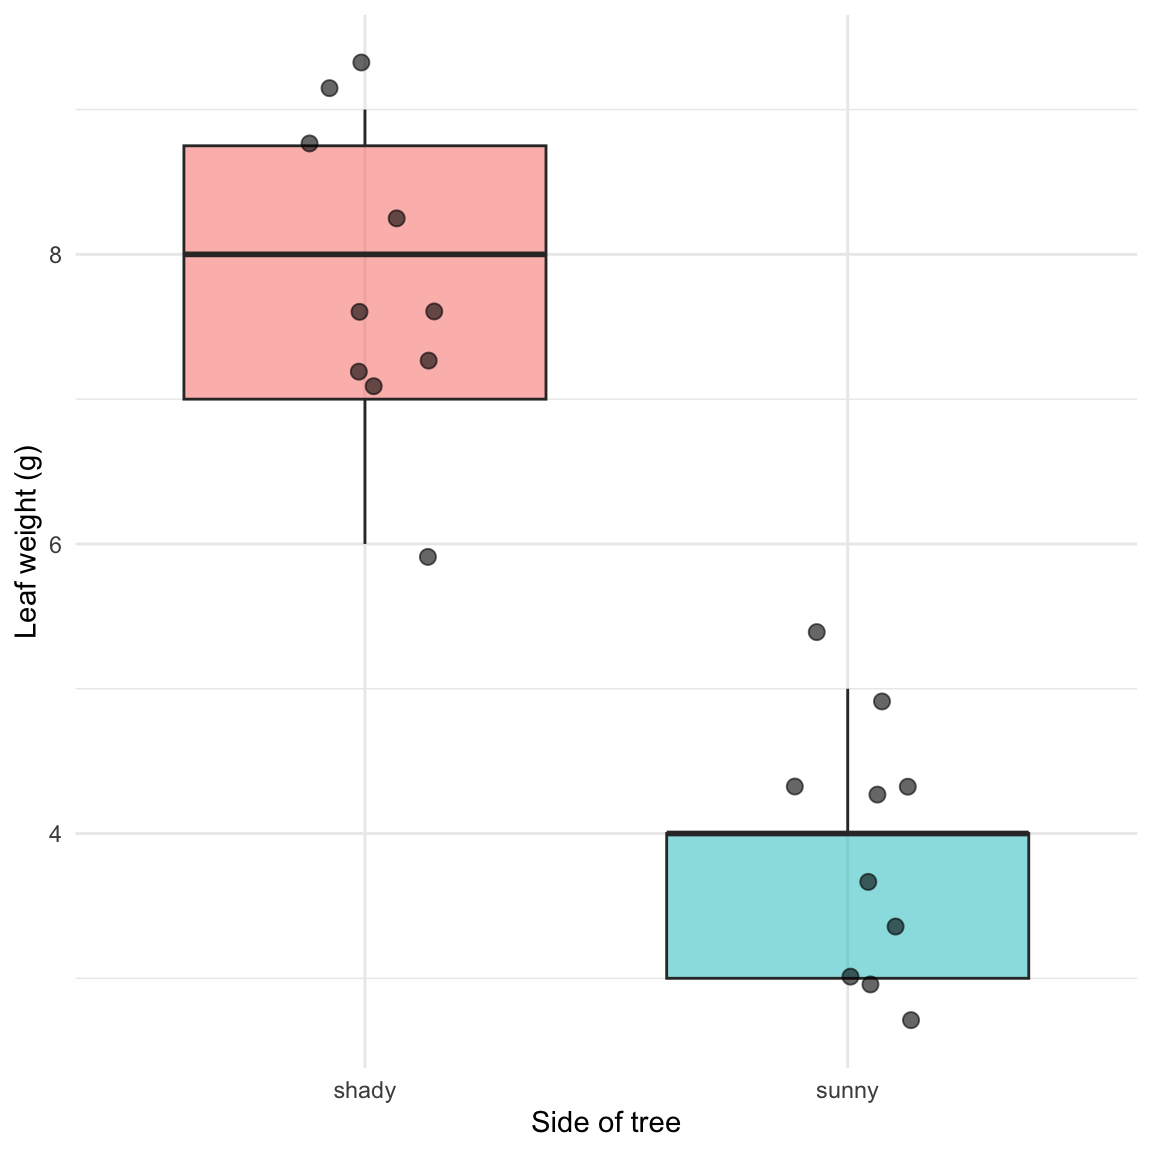
On average, shady-side leaves weighed 7.8 g and sunny-side leaves weighed 3.8 g. (Notice: those numbers are inserted with inline code — change the data and the sentence updates itself.)
Discussion
Write one short paragraph here: did the data support the hypothesis? Were shady leaves heavier? Mention the size of the difference and anything you noticed in Figure 1. In Lecture 05 you will add the formal t-test result to this section.
References
- Wickham, H. R for Data Science (2nd ed.) — https://r4ds.hadley.nz/
- Data Carpentry — https://datacarpentry.github.io/R-ecology-lesson/