| side | n | mean_wt | sd_wt | se_wt |
|---|---|---|---|---|
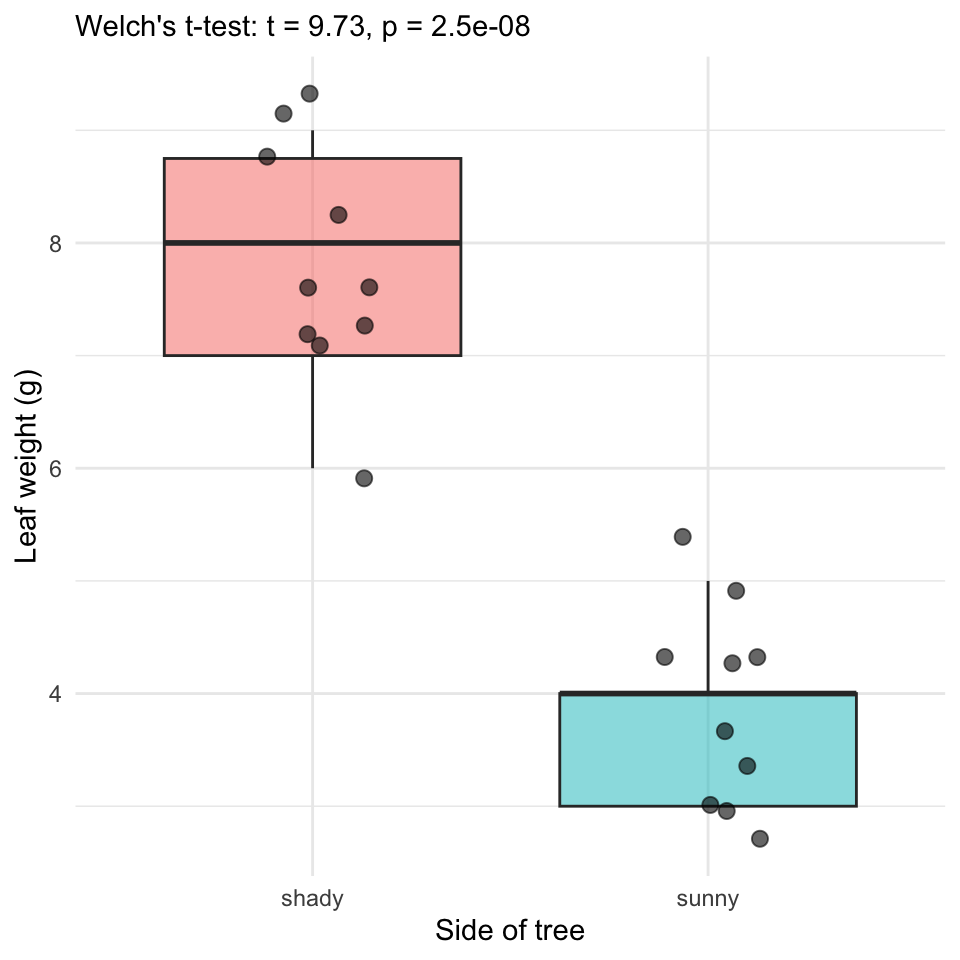
| shady | 10 | 7.8 | 1.03 | 0.33 |
| sunny | 10 | 3.8 | 0.79 | 0.25 |
Do Shady Leaves Weigh More? A Two-Sample t-Test
A reproducible write-up of the Worksheet 04 analysis
Introduction
Leaves on the shady side of a tree may grow larger and heavier to capture more of the limited light beneath the canopy. We measured the weight (g) of ten leaves from each side of a tree and tested whether mean leaf weight differs between sides.
- Null hypothesis (H₀): \(\mu_{shady} = \mu_{sunny}\) — no difference in mean weight
- Alternate hypothesis (Hₐ): \(\mu_{shady} \neq \mu_{sunny}\) — the means differ
We used a two-tailed test at \(\alpha = 0.05\).
Methods
We compared the two sides with a Welch’s two-sample t-test (var.equal = FALSE), which does not assume equal variances. Before testing we checked normality within each group with a Shapiro–Wilk test. All analysis was done in R with the tidyverse, and this report was produced in Quarto so that every value below is computed directly from the raw data.
Results
Shady-side leaves were significantly heavier than sunny-side leaves (Welch’s two-sample t-test: t(16.8) = 9.73, p = 2.5^{-8}). Mean ± SE weight was 7.8 ± 0.33 g for shady leaves and 3.8 ± 0.25 g for sunny leaves.
Every statistic in that sentence — t, df, p, and both means ± SE — was inserted with inline code such as 9.73. If a leaf measurement changed, you would fix the data file, press Render, and the sentence would rewrite itself. In a plain script you would retype all of these by hand.
Conclusion
At \(\alpha = 0.05\) we reject the null hypothesis: mean leaf weight differs between the sunny and shady sides of the tree, with shady leaves heavier. This matches the biological prediction that shade leaves grow larger to capture more of the limited light. (Add a sentence of your own interpretation here.)
References
- Whitlock, M. & Schluter, D. The Analysis of Biological Data (2nd ed.).
- Wickham, H. R for Data Science (2nd ed.) — https://r4ds.hadley.nz/